

- For , using a dedicated Prometheus exporter in .
- For , using Postgres Exporter.
Prerequisites
To follow the steps on this page:- Download and run Prometheus.
- For : Create a target with the time-series and analytics capability enabled.
-
For :
- Create a target instance. You need your connection details.
- Install Postgres Exporter. To reduce latency and potential data transfer costs, install Prometheus and Postgres Exporter on a machine in the same AWS region as your .
This feature is currently not supported for on Microsoft Azure.
Export Tiger Cloud service telemetry to Prometheus
To export your data, do the following:To export metrics from a , you create a dedicated Prometheus exporter in , attach it to your , then configure Prometheus to scrape metrics using the exposed URL. The Prometheus exporter exposes the metrics related to the like CPU, memory, and storage. To scrape other metrics, use Postgres Exporter as described for . The Prometheus exporter is available for and s.
-
Create a Prometheus exporter
-
In , click
Exporters>+ New exporter. -
Select
Metricsfor data type andPrometheusfor provider.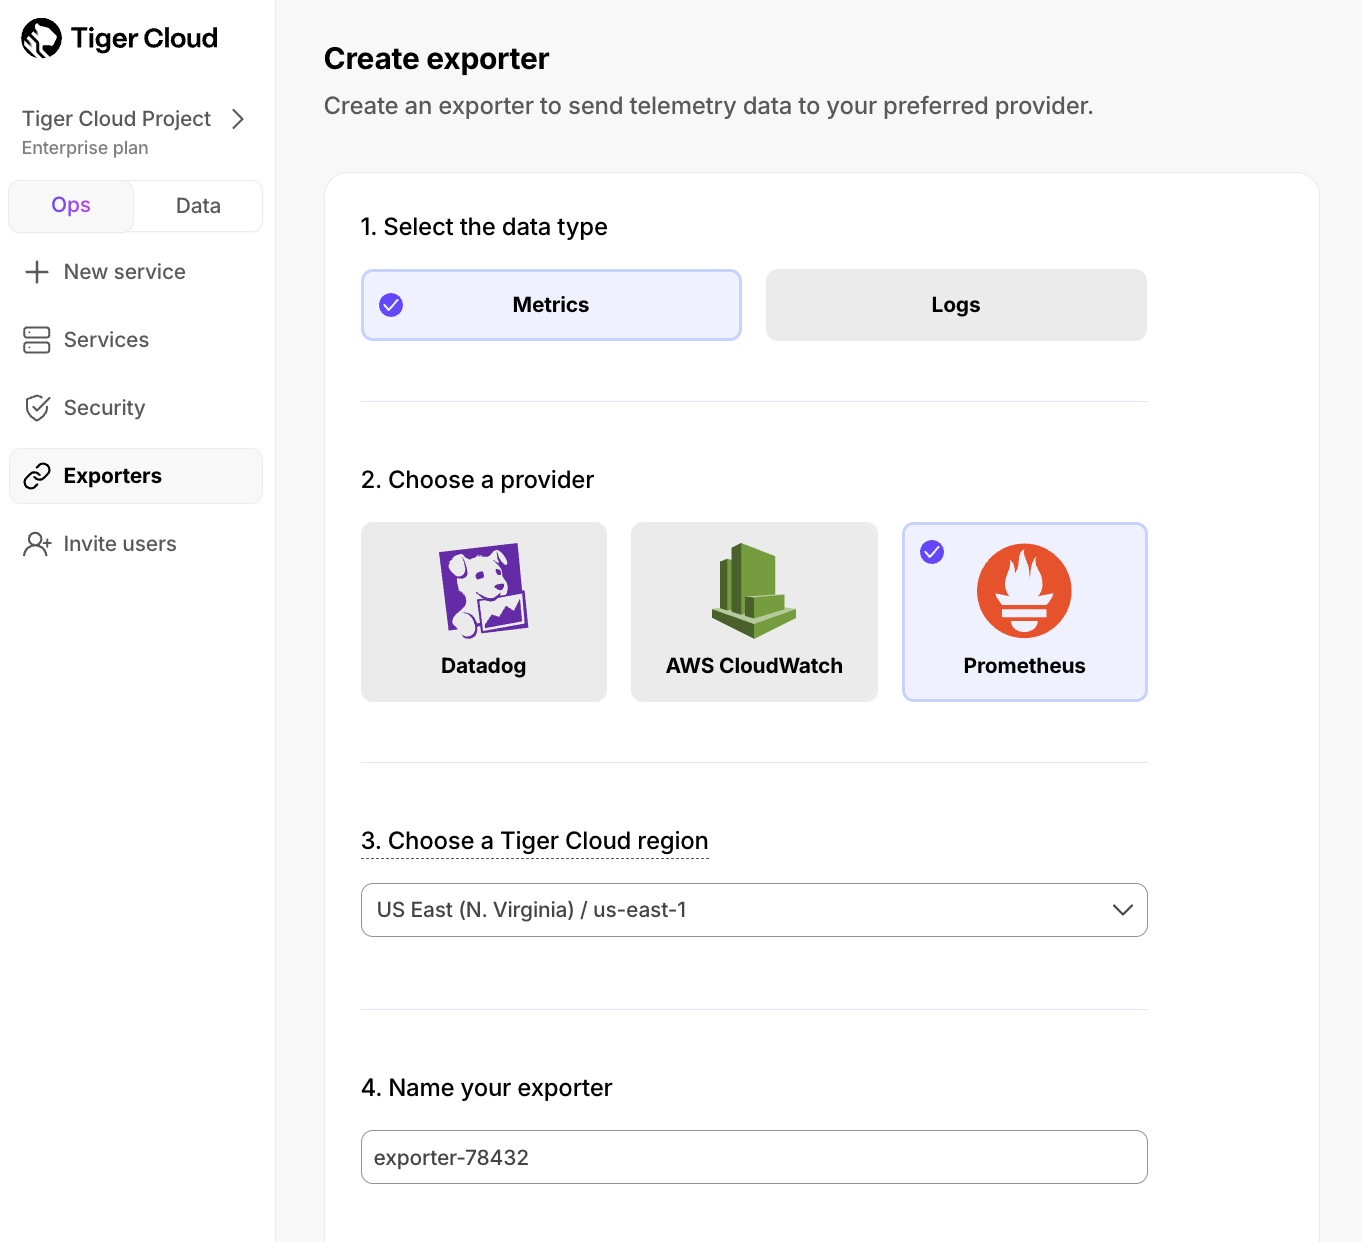
- Choose the region for the exporter. Only s in the same project and region can be attached to this exporter.
- Name your exporter.
-
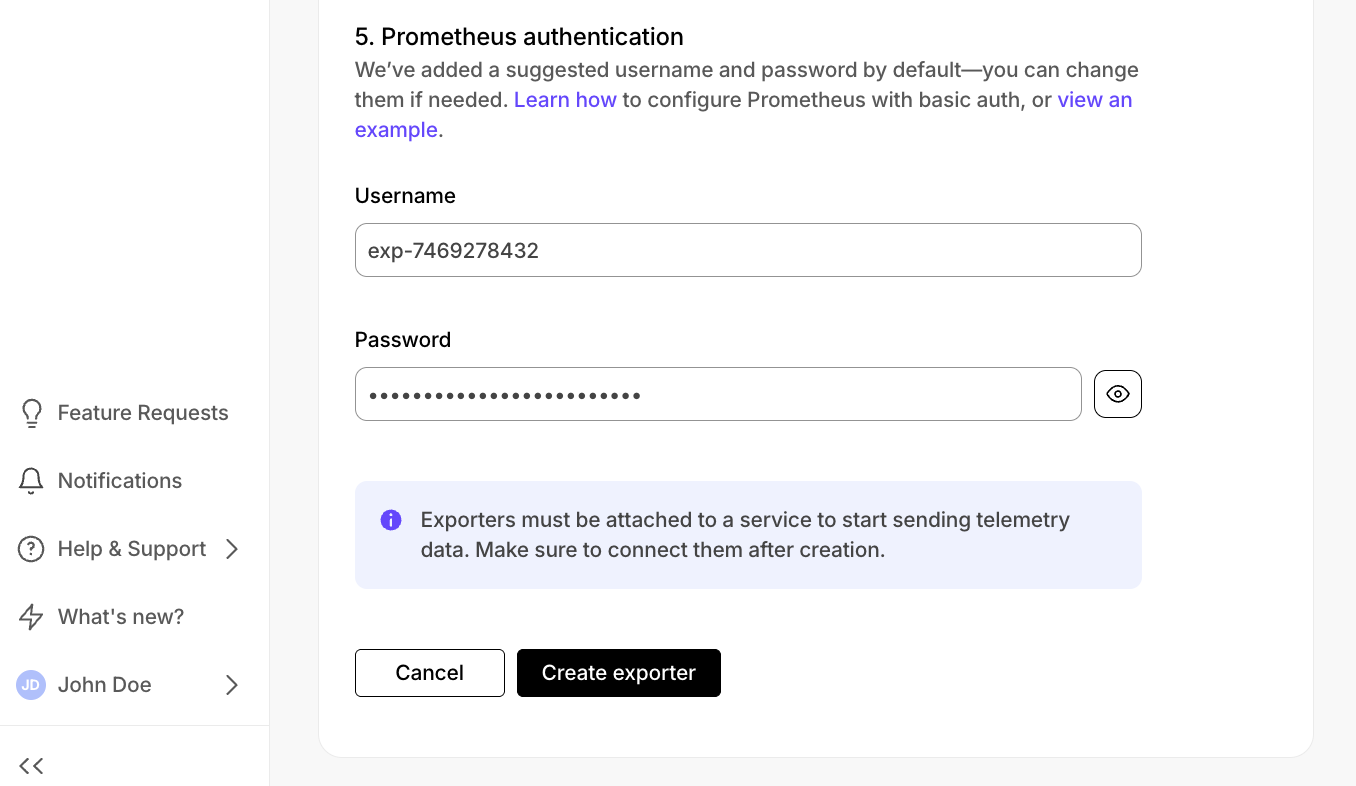
Change the auto-generated Prometheus credentials, if needed. See official documentation on basic authentication in Prometheus.
-
In , click
-
Attach the exporter to a
-
Select a , then click
Operations>Exporters. -
Select the exporter in the drop-down, then click
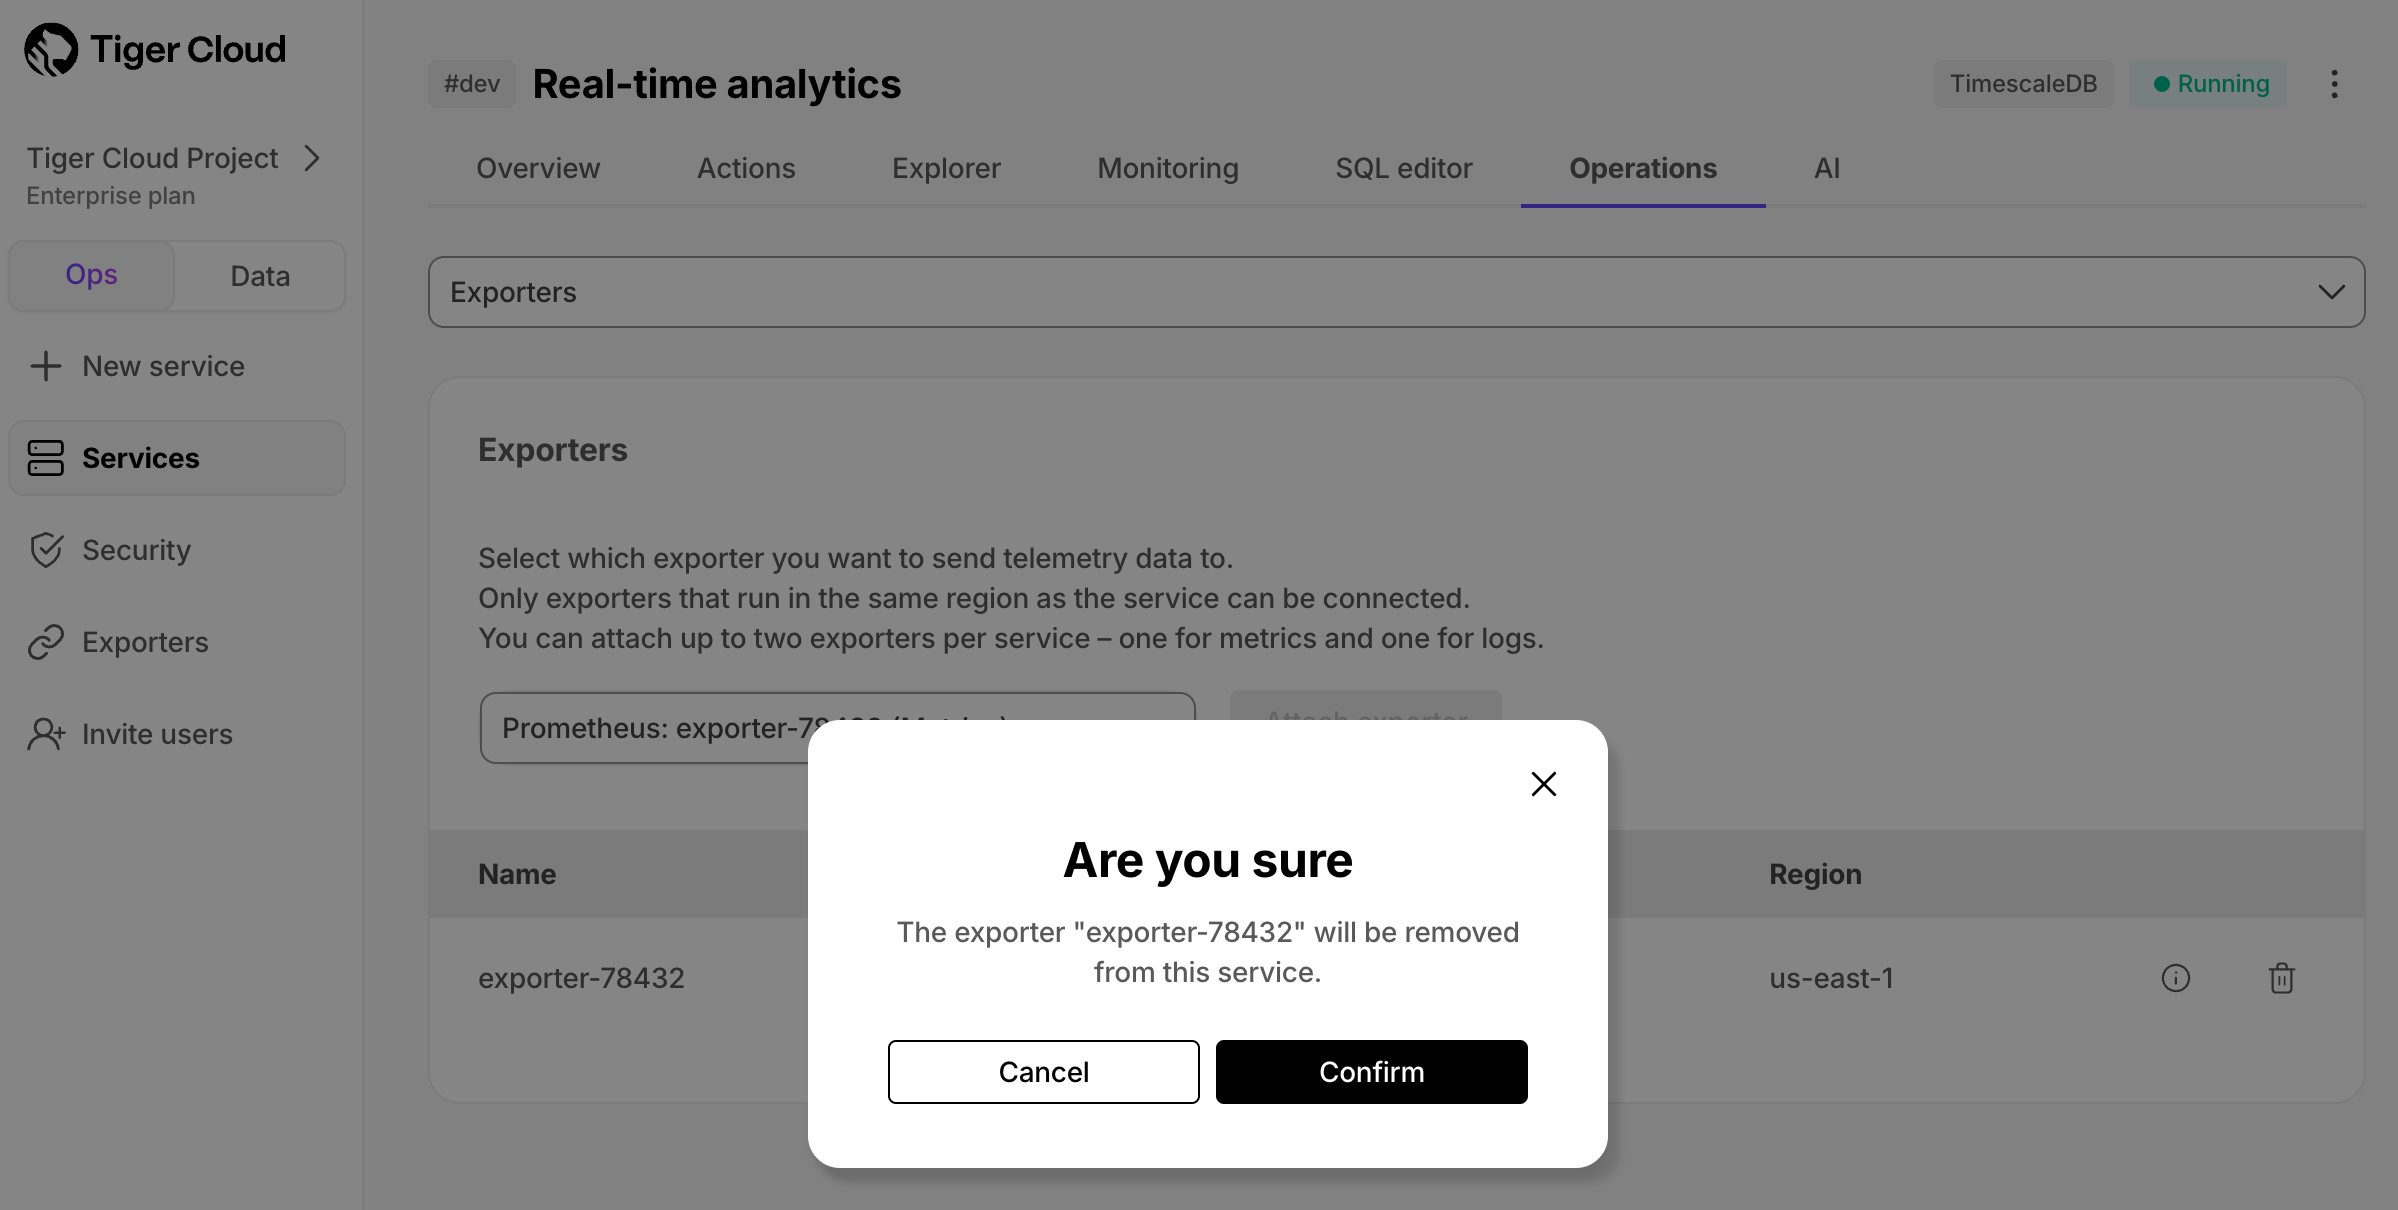
Attach exporter.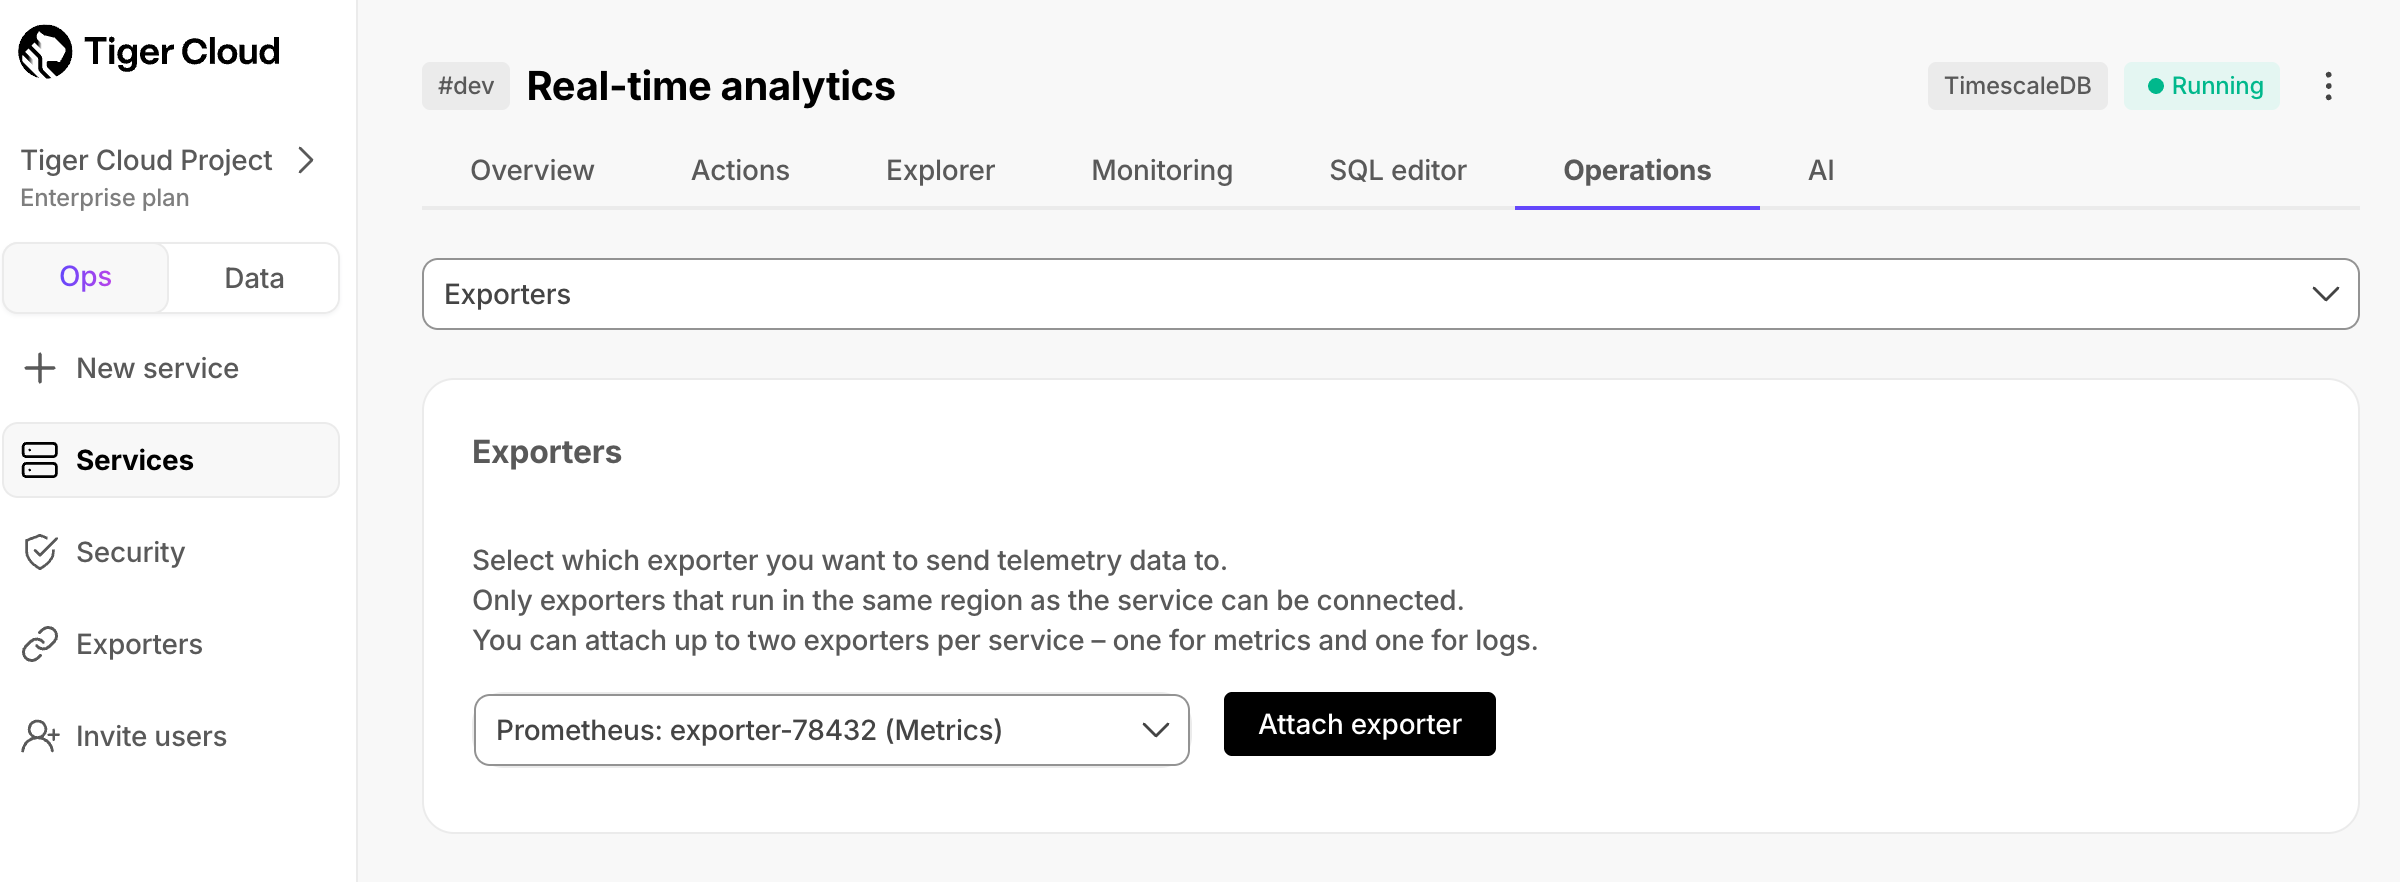 The exporter is now attached to your . To unattach it, click the trash icon in the exporter list.
-
Select a , then click
-
Configure the Prometheus scrape target
-
Select your service, then click
Operations>Exportersand click the information icon next to the exporter. You see the exporter details.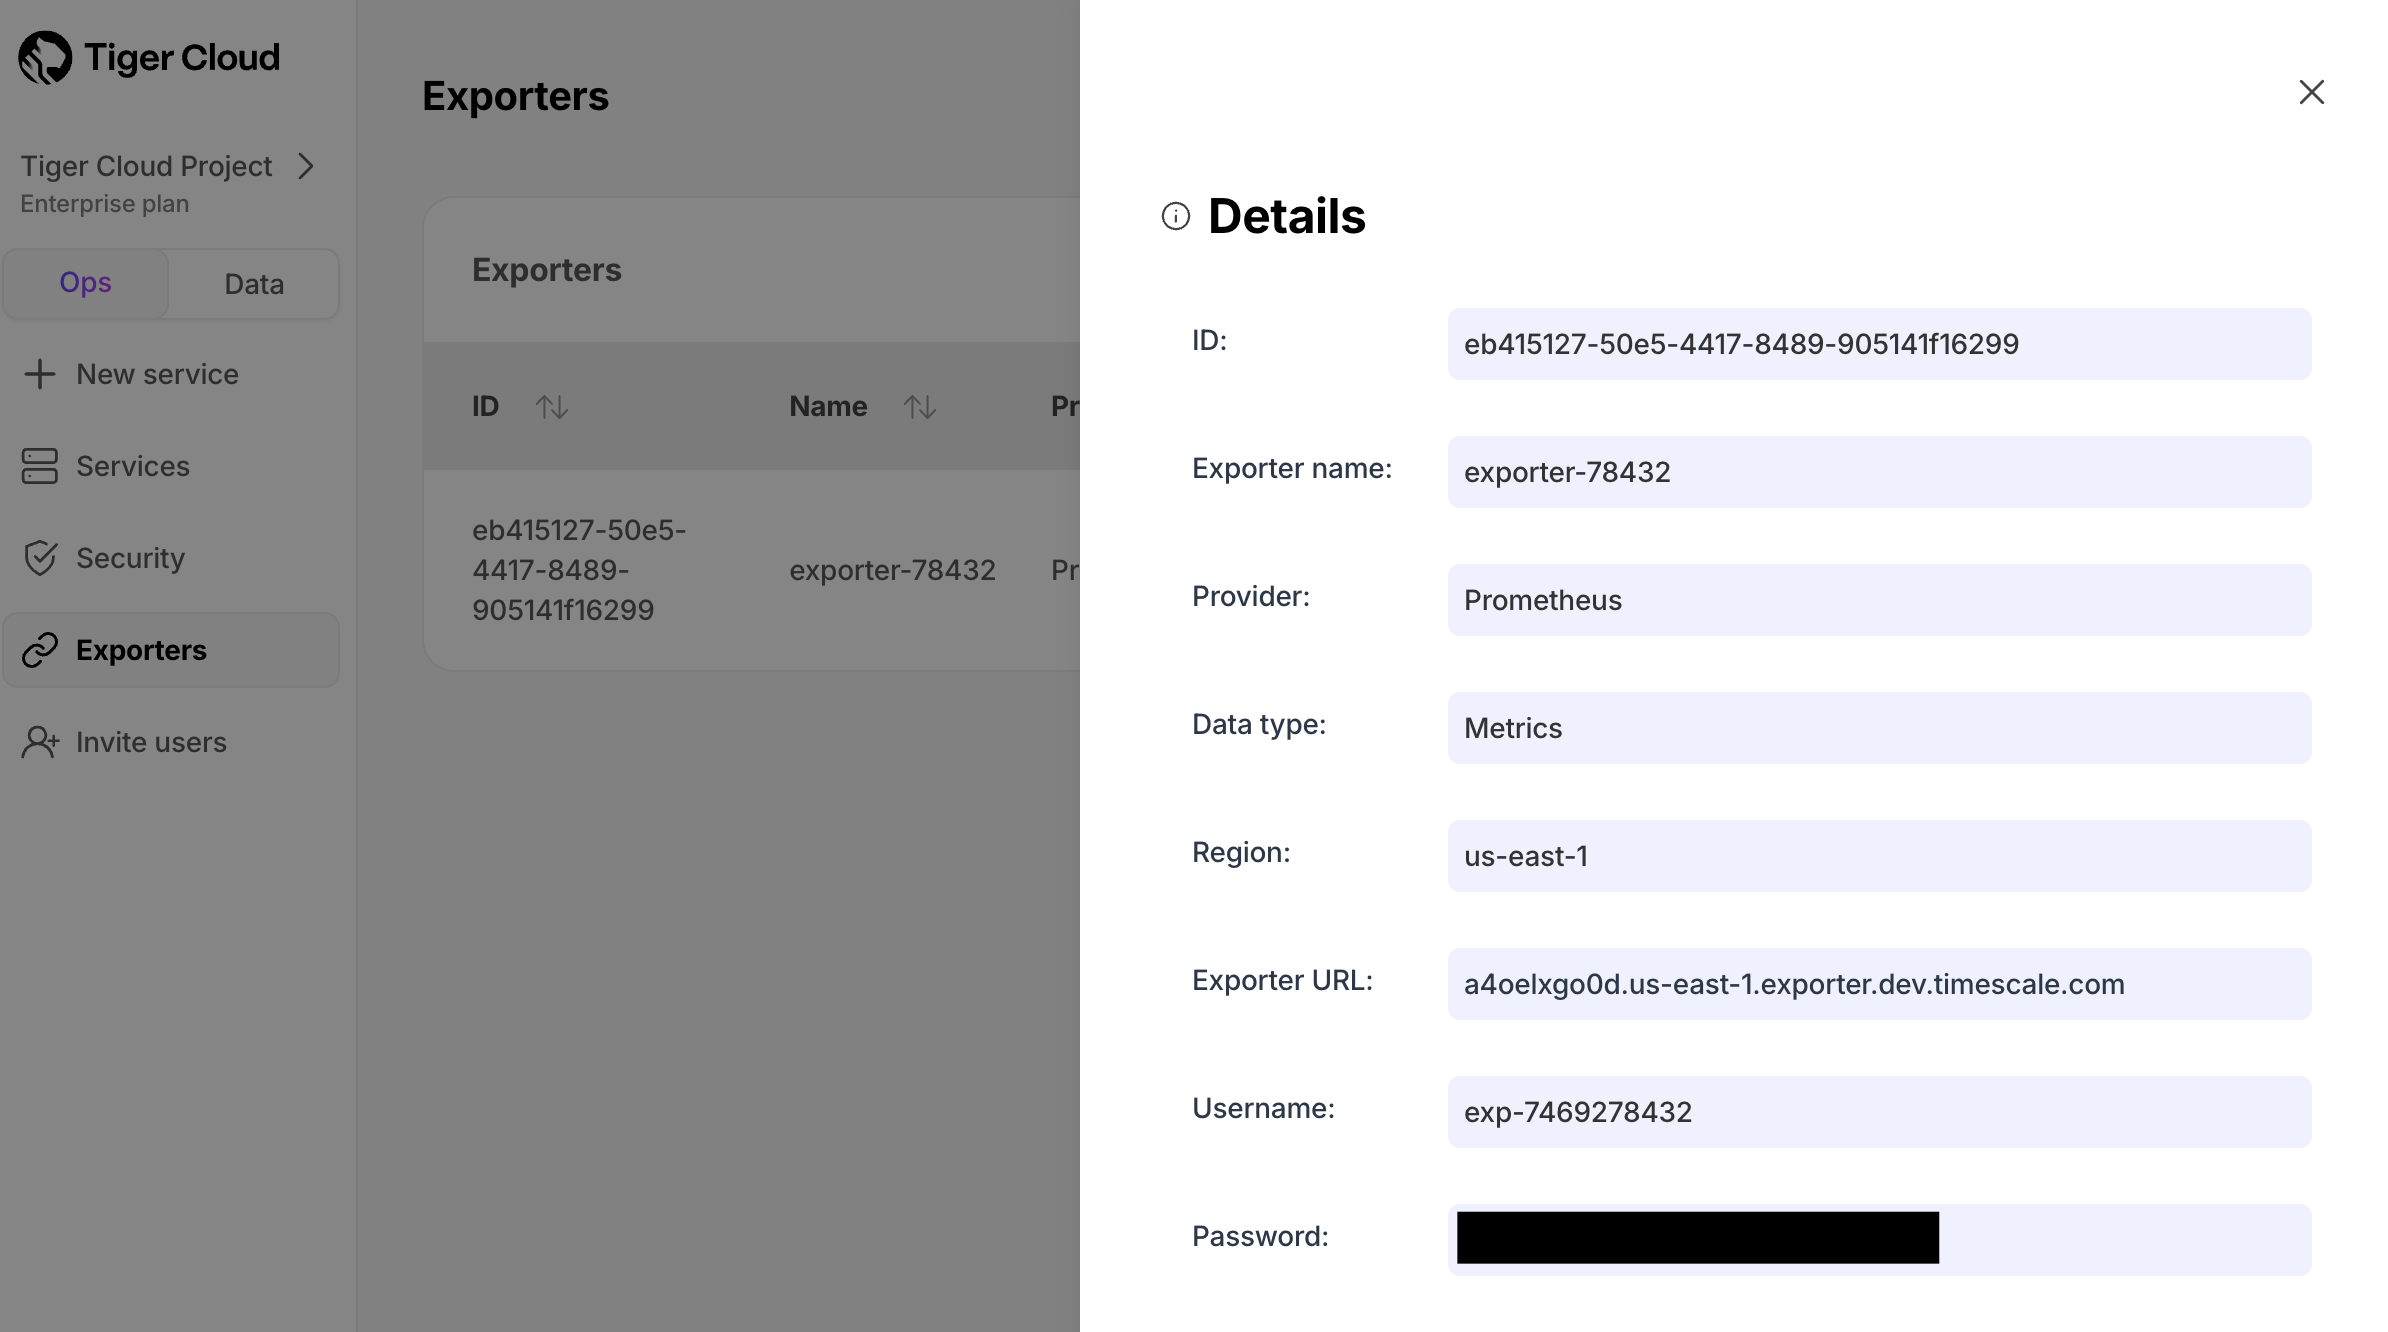
- Copy the exporter URL.
-
In your Prometheus installation, update
prometheus.ymlto point to the exporter URL as a scrape target:See the Prometheus documentation for details on configuring scrape targets. You can now monitor your metrics. Use the following metrics to check the service is running correctly:timescale.cloud.system.cpu.usage.millicorestimescale.cloud.system.cpu.total.millicorestimescale.cloud.system.memory.usage.bytestimescale.cloud.system.memory.total.bytestimescale.cloud.system.disk.usage.bytestimescale.cloud.system.disk.total.bytes
Tag Example variable Description hostus-east-1.timescale.cloudproject-idservice-idregionus-east-1AWS region rolereplicaorprimaryFor with replicas
-
Select your service, then click