This page explains how to:
-
Monitor metrics with Datadog
This integration is available for and s.
-
Configure Datadog Agent to collect metrics for your
This integration is available for all s.
Prerequisites
To follow the steps on this page:
-
Create a target with the Real-time analytics capability enabled.
You need your connection details.
This feature is currently not supported for on Microsoft Azure.
Monitor Tiger Cloud service metrics with Datadog
Export telemetry data from your s with the time-series and analytics capability enabled to
Datadog using a data exporter. The available metrics include CPU usage, RAM usage, and storage.
Create a data exporter
A data exporter sends telemetry data from a to a third-party monitoring
tool. You create an exporter on the project level, in the same AWS region as your :
-
In , open Exporters
-
Click
New exporter
-
Select
Metrics for Data type and Datadog for provider
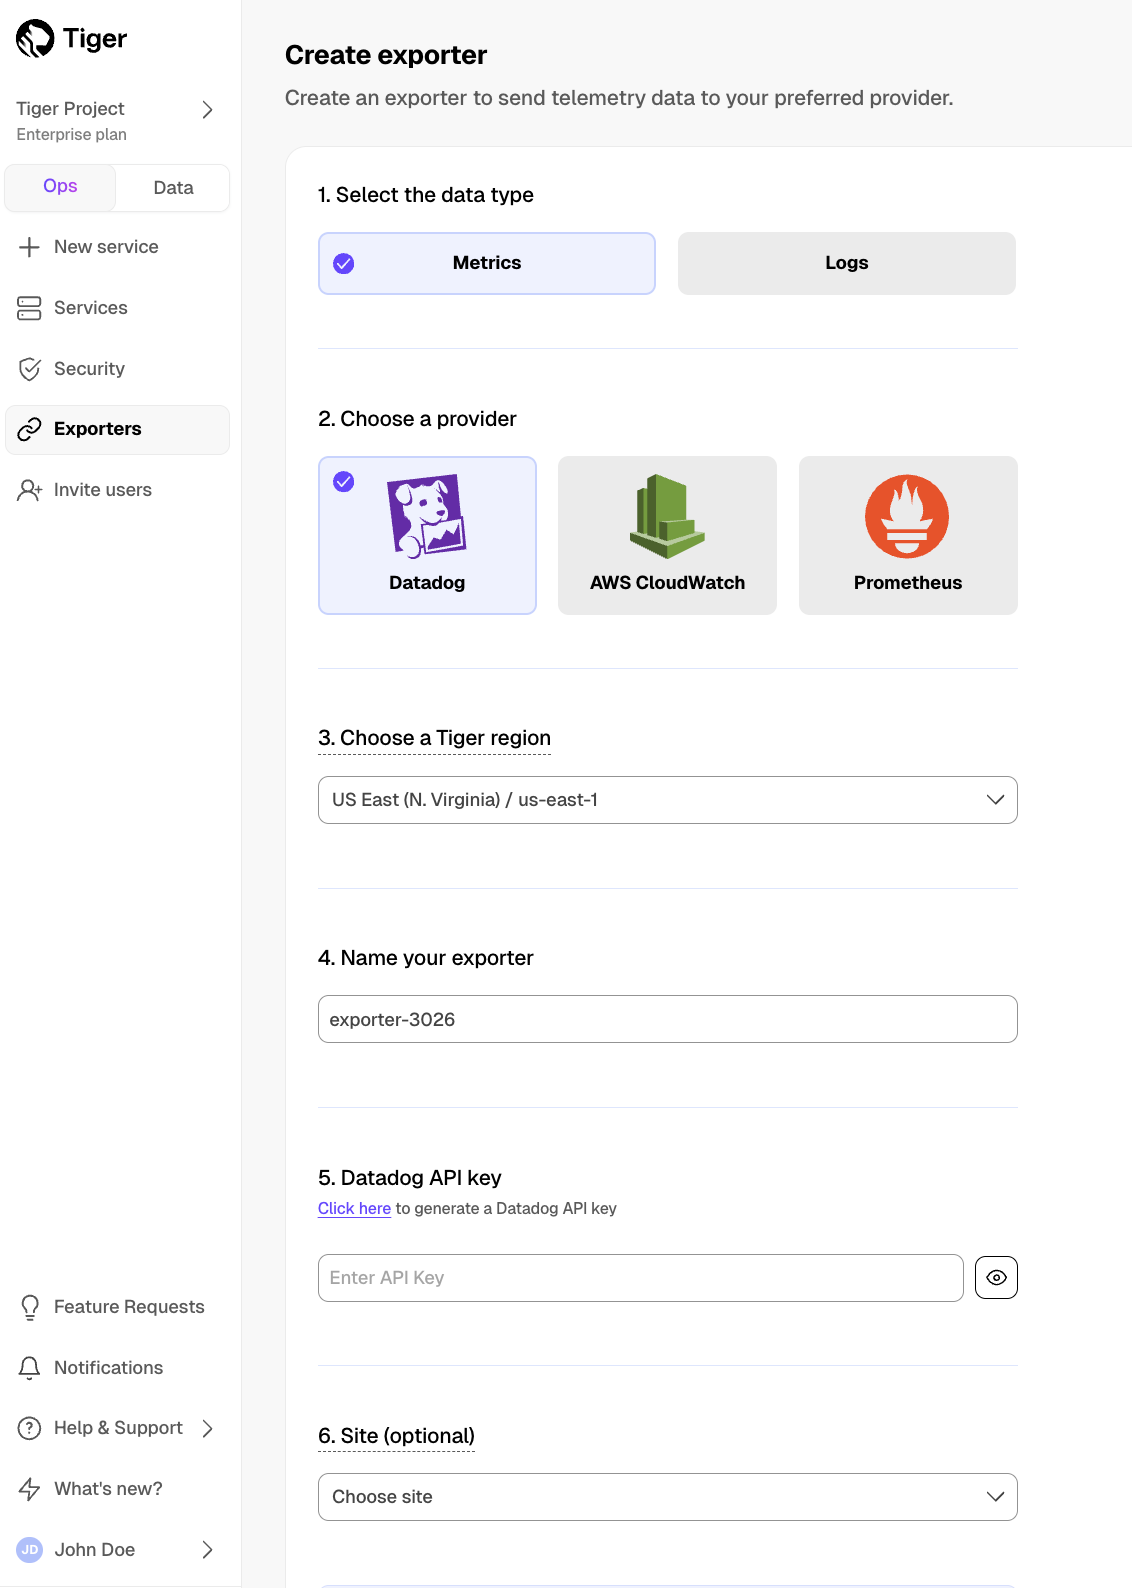
-
Choose your AWS region and provide the API key
The AWS region must be the same for your exporter and the Datadog provider.
-
Set
Site to your Datadog region, then click Create exporter
Manage a data exporter
This section shows you how to attach, monitor, edit, and delete a data exporter.
Attach a data exporter to a Tiger Cloud service
To send telemetry data to an external monitoring tool, you attach a data exporter to your
. You can attach only one exporter to a .
To attach an exporter:
- In , choose the
- Click
Operations > Exporters
- Select the exporter, then click
Attach exporter
- If you are attaching a first
Logs data type exporter, restart the
Monitor Tiger Cloud service metrics
You can now monitor your metrics. Use the following metrics to check the service is running correctly:
timescale.cloud.system.cpu.usage.millicorestimescale.cloud.system.cpu.total.millicorestimescale.cloud.system.memory.usage.bytestimescale.cloud.system.memory.total.bytestimescale.cloud.system.disk.usage.bytestimescale.cloud.system.disk.total.bytes
Additionally, use the following tags to filter your results.
| Tag | Example variable | Description |
|---|
host | us-east-1.timescale.cloud | |
project-id | | |
service-id | | |
region | us-east-1 | AWS region |
role | replica or primary | For with replicas |
node-id | | For multi-node services |
Edit a data exporter
To update a data exporter:
- In , open Exporters
- Next to the exporter you want to edit, click the menu >
Edit
- Edit the exporter fields and save your changes
You cannot change fields such as the provider or the AWS region.
Delete a data exporter
To remove a data exporter that you no longer need:
-
Disconnect the data exporter from your Tiger Cloud services
- In , choose the .
- Click
Operations > Exporters.
- Click the trash can icon.
- Repeat for every attached to the exporter you want to remove.
The data exporter is now unattached from all s. However, it still exists in your project.
-
Delete the exporter on the project level
- In , open Exporters
- Next to the exporter you want to edit, click menu >
Delete
- Confirm that you want to delete the data exporter.
Reference
When you create the IAM OIDC provider, the URL must match the region you create the exporter in.
It must be one of the following:
| Region | Zone | Location | URL |
|---|
ap-southeast-1 | Asia Pacific | Singapore | irsa-oidc-discovery-prod-ap-southeast-1.s3.ap-southeast-1.amazonaws.com |
ap-southeast-2 | Asia Pacific | Sydney | irsa-oidc-discovery-prod-ap-southeast-2.s3.ap-southeast-2.amazonaws.com |
ap-northeast-1 | Asia Pacific | Tokyo | irsa-oidc-discovery-prod-ap-northeast-1.s3.ap-northeast-1.amazonaws.com |
ca-central-1 | Canada | Central | irsa-oidc-discovery-prod-ca-central-1.s3.ca-central-1.amazonaws.com |
eu-central-1 | Europe | Frankfurt | irsa-oidc-discovery-prod-eu-central-1.s3.eu-central-1.amazonaws.com |
eu-west-1 | Europe | Ireland | irsa-oidc-discovery-prod-eu-west-1.s3.eu-west-1.amazonaws.com |
eu-west-2 | Europe | London | irsa-oidc-discovery-prod-eu-west-2.s3.eu-west-2.amazonaws.com |
sa-east-1 | South America | São Paulo | irsa-oidc-discovery-prod-sa-east-1.s3.sa-east-1.amazonaws.com |
us-east-1 | United States | North Virginia | irsa-oidc-discovery-prod.s3.us-east-1.amazonaws.com |
us-east-2 | United States | Ohio | irsa-oidc-discovery-prod-us-east-2.s3.us-east-2.amazonaws.com |
us-west-2 | United States | Oregon | irsa-oidc-discovery-prod-us-west-2.s3.us-west-2.amazonaws.com |
-
Connect to your
For , open an SQL editor in . For , use
psql.
-
Add the
datadog user to your
create user datadog with password '<password>';
grant pg_monitor to datadog;
grant SELECT ON pg_stat_database to datadog;
-
Test the connection and rights for the datadog user
Update the following command with your connection details, then run it from the command line:
 psql "postgres://datadog:<datadog password>@<host>:<port>/tsdb?sslmode=require" -c \
 "select * from pg_stat_database LIMIT(1);" \
 && echo -e "\e[0;32mPostgres connection - OK\e[0m" || echo -e "\e[0;31mCannot connect to Postgres\e[0m"
pg_stat_database table, which means you have given the correct rights to datadog.
-
Connect Datadog to your
-
Configure the Datadog Agent configuration file; it is usually located on the Datadog Agent host at:
- Linux:
/etc/datadog-agent/conf.d/postgres.d/conf.yaml
- MacOS:
/opt/datadog-agent/etc/conf.d/postgres.d/conf.yaml
- Windows:
C:\ProgramData\Datadog\conf.d\postgres.d\conf.yaml
-
Integrate Datadog Agent with your :
Use your connection details to update the following and add it to the Datadog Agent
configuration file:
init_config:

instances:
- host: <host>
  port: <port>
  username: datadog
  password: <datadog's password>>
  dbname: tsdb
  disable_generic_tags: true
-
Add metrics
Tags to make it easier for build Datadog dashboards that combine metrics from the data exporter and
Datadog Agent. Use your connection details to update the following and add it to
<datadog_home>/datadog.yaml:
tags:
  - project-id:<project-id>
  - service-id:<service-id>
  - region:<region>
-
Restart Datadog Agent
See how to Start, stop, and restart Datadog Agent.
Metrics for your are now visible in Datadog. Check the Datadog integration documentation for a
comprehensive list of metrics collected. 
